● Coming soon to iOS & Android

Most journals tell you what you made.
Hone In tells you why.

A trading journal for swing traders that measures your process, not just your profit. Track risk before result, find where your money actually goes, and see the difference between a good trade and a lucky one.

1 month free · Import your existing journal · Export anytime, free

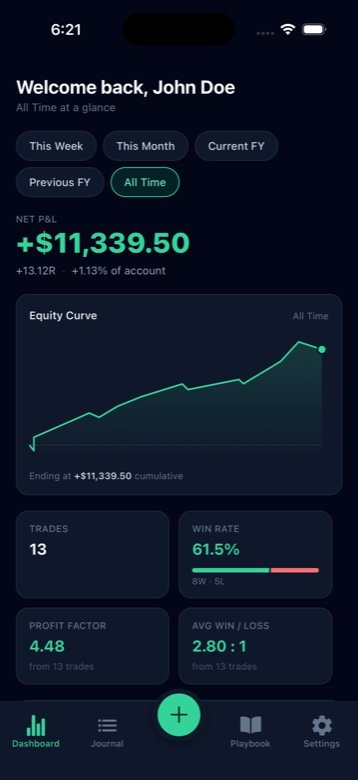
Hone In dashboard screenshot showing net P&L, equity curve, win rate and profit factor for a demo account

Actual app screenshot · demo account shown

Inside the app

Four screens. Every trade, honestly measured.

Real screenshots from the current build — the same ones submitted to the App Store and Play Store. Tap a tab to switch screens.

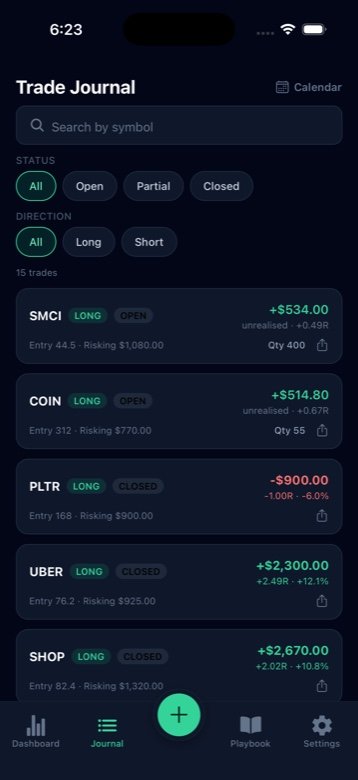
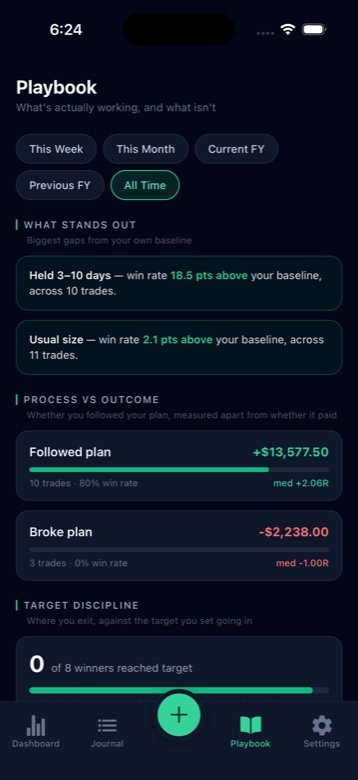
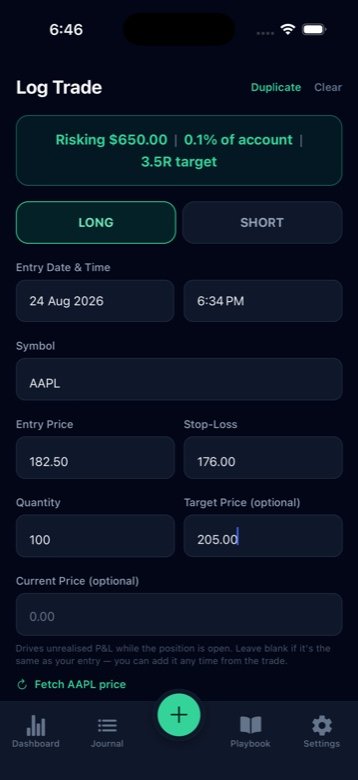
Dashboard screen: net P&L, equity curve, trades, win rate, profit factor and average win/loss Journal screen: list of trades filterable by status and direction, each showing entry, risk, size and unrealised or realised result Playbook screen: behavioural breakdowns, plan adherence and target discipline stats Log Trade screen: entry, stop-loss, quantity and target fields with live calculated risk and R-multiple target

Dashboard

Everything that matters on one screen, filtered by week, month, financial year or all time: net P&L in both currency and R, an equity curve, and the four numbers that actually describe an edge.

  • ✓Win rate and trade count side by side, not win rate alone
  • ✓Profit factor and average win/loss ratio, calculated automatically
  • ✓Every figure re-computed the moment you change the date range

Screens shown use a demo account for illustration. Your own trades are private and visible only to you.
How it works

Log the trade. Hone In does the rest.

Enter your entry, stop and size — your live risk appears as you type. Everything after that is calculated for you, in R, so a ₹500 trade and a ₹50,000 trade can finally be compared honestly.

0
Trackers, ads or analytics SDKs
0
Behavioural breakdowns in Playbook
0
Fields to see live risk while logging
0%
Of your data exportable, always free

Risk before result

Live risk while you log, and total open risk across every position on your dashboard — because five sensible trades can still add up to one bad morning.

Exit discipline

You set a target going in. Hone In shows how much of that move you actually captured — the leak almost every journal stores the data for and never reports.

Process vs outcome

One tap at exit: did this go to plan? Then see what you earned on trades where you broke your own rules — the number that quietly teaches bad habits.

Patterns that matter

Performance by position size, holding period, strategy and how you trade after a loss. Nothing is claimed from a handful of trades — sample sizes are always shown.

Bring your history

Import an existing spreadsheet or broker export. Column names are detected automatically, however you happened to label them.

Your data, always

Export everything to CSV at any time — free, no subscription needed. It re-imports cleanly, because a journal you can't take with you isn't yours.

“0 of 18 winning trades reached their target.
The typical winner captured 13% of the move you planned for.”

An actual finding from a real 32-trade journal — data the app already had, and no spreadsheet was reporting.

Privacy

No analytics. No trackers. No ads. None.

Hone In contains no analytics SDK, no crash reporter, no advertising identifier and no third-party tracker. Nothing you do inside the app is measured or reported to anyone. Your trades are yours, your notes are private, and we never sell data — because we never collect it.

✓Works offline — your journal lives on your device too
✓Chart screenshots stored privately, never public
✓Delete your account and everything in it, instantly
✓Price lookups send only a ticker symbol, nothing else
Pricing

One month free. Then less than a single bad trade.

Every feature included on both plans. No tiers, no add-ons, no upsells.

SAVE 37%
Annual
₹1,499 / year
Works out at ₹125 a month
Monthly
₹199 / month
Cancel any time
✓Unlimited trades and chart screenshots
✓Full behavioural analytics and Playbook
✓Import from any spreadsheet or broker CSV
✓Shareable trade cards
✓Weekly review reminders
✓Export to CSV — free, always

Prices shown in Indian rupees. Local pricing applies in other countries and is shown in the app before you subscribe.

Questions

Fair questions.

What is R, and why is everything measured in it?

One R is what you risked on a trade — the distance between your entry and your stop, multiplied by your size. A trade returning twice what you risked is +2R. It lets you compare a small trade with a large one honestly, which rupee amounts can't. It's the unit professionals think in, and Hone In is built around it.

Does Hone In tell me what to trade?

No, and it never will. Hone In describes trades you have already made. It gives no recommendations, makes no predictions, and offers no view on any instrument. It is a record-keeping and review tool, not investment advice.

Can I bring my existing spreadsheet?

Yes. Import a CSV from a spreadsheet or a broker export and Hone In works out which column is which, whatever you called them. You review the mapping before anything is saved.

What happens to my data if I stop paying?

Your trades stay, and you can still read everything you've logged and export it in full. A subscription is needed to add new trades, not to reach your own history.

Does it work offline?

Yes. Your journal is stored on your device as well as in the cloud, so it opens instantly and works without a connection. Changes sync when you're back online.

Which markets does it support?

Any market. You type the symbol, so Indian equities, US stocks, futures, crypto and anything else all work. Optional price lookup covers most major exchanges.